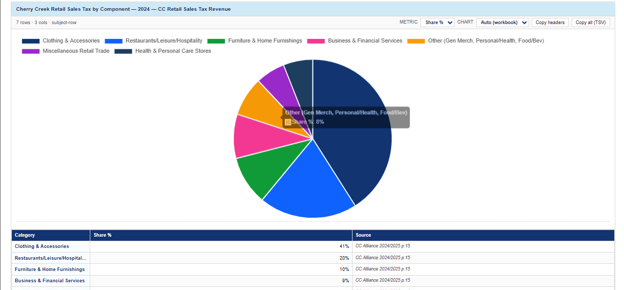
The Visual Story
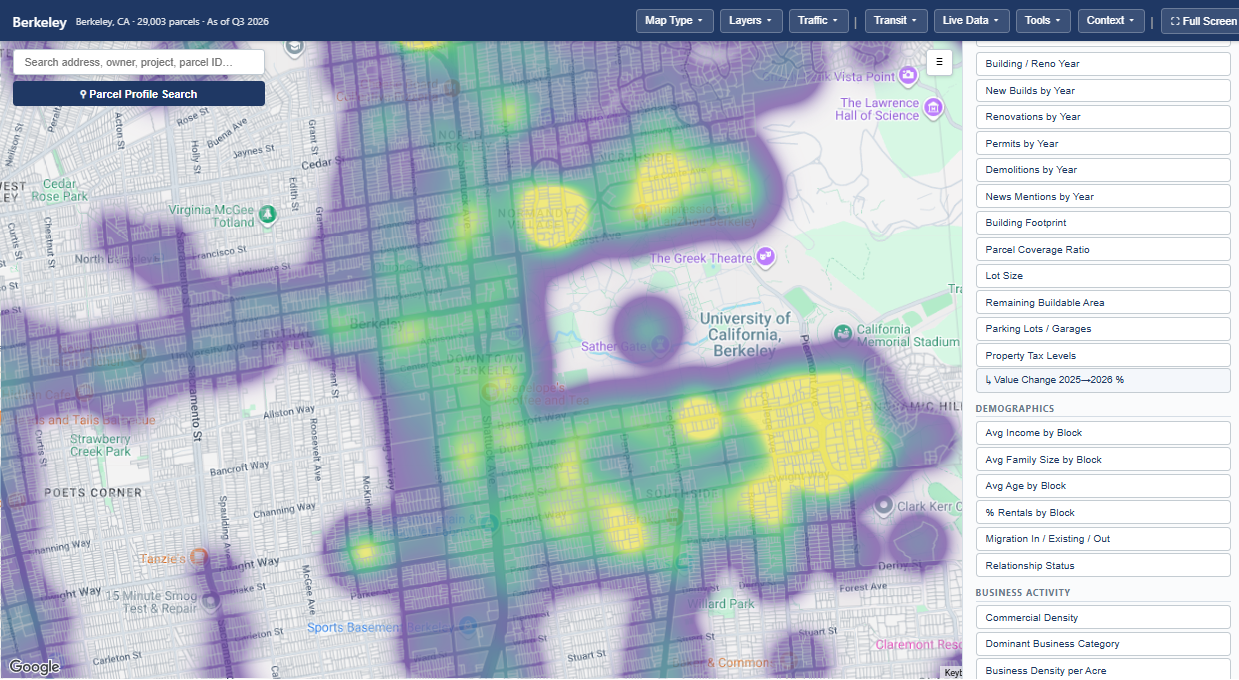
This is not just a parcel map, though it does contain parcel data. It is a central collection of data that can be used to tell the visual story of the market. It includes pattern mapping of all current and historical data able to be assigned to a specific location within the Cherry Creek neighborhood in Denver. It includes visualized data from news articles, government sources, data services, local organizations, and other third party utilities. There are also a number of unique live data layers and analytical tools built into the map. Finally, the profile search tool serves as a filter for users interested in a specific profile of characteristics.
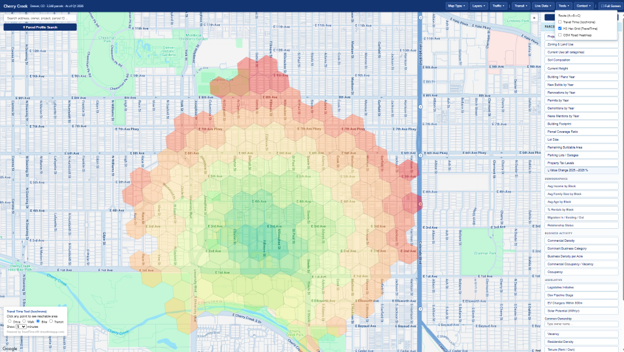
Hex Time Heat Maps
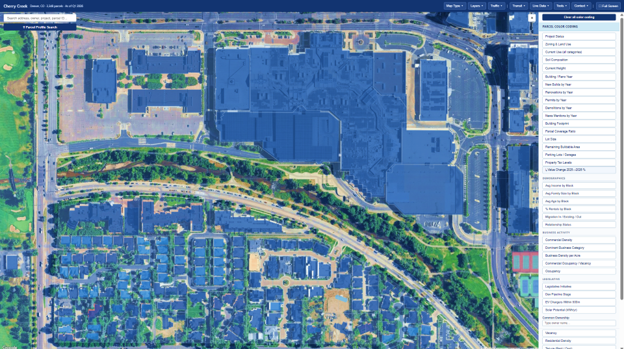
3D Building Data
Demand
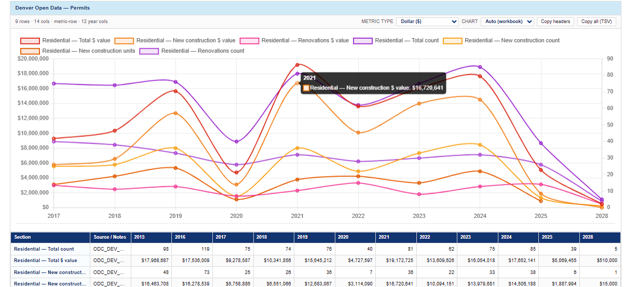
Supply Trends
Modality Mapping
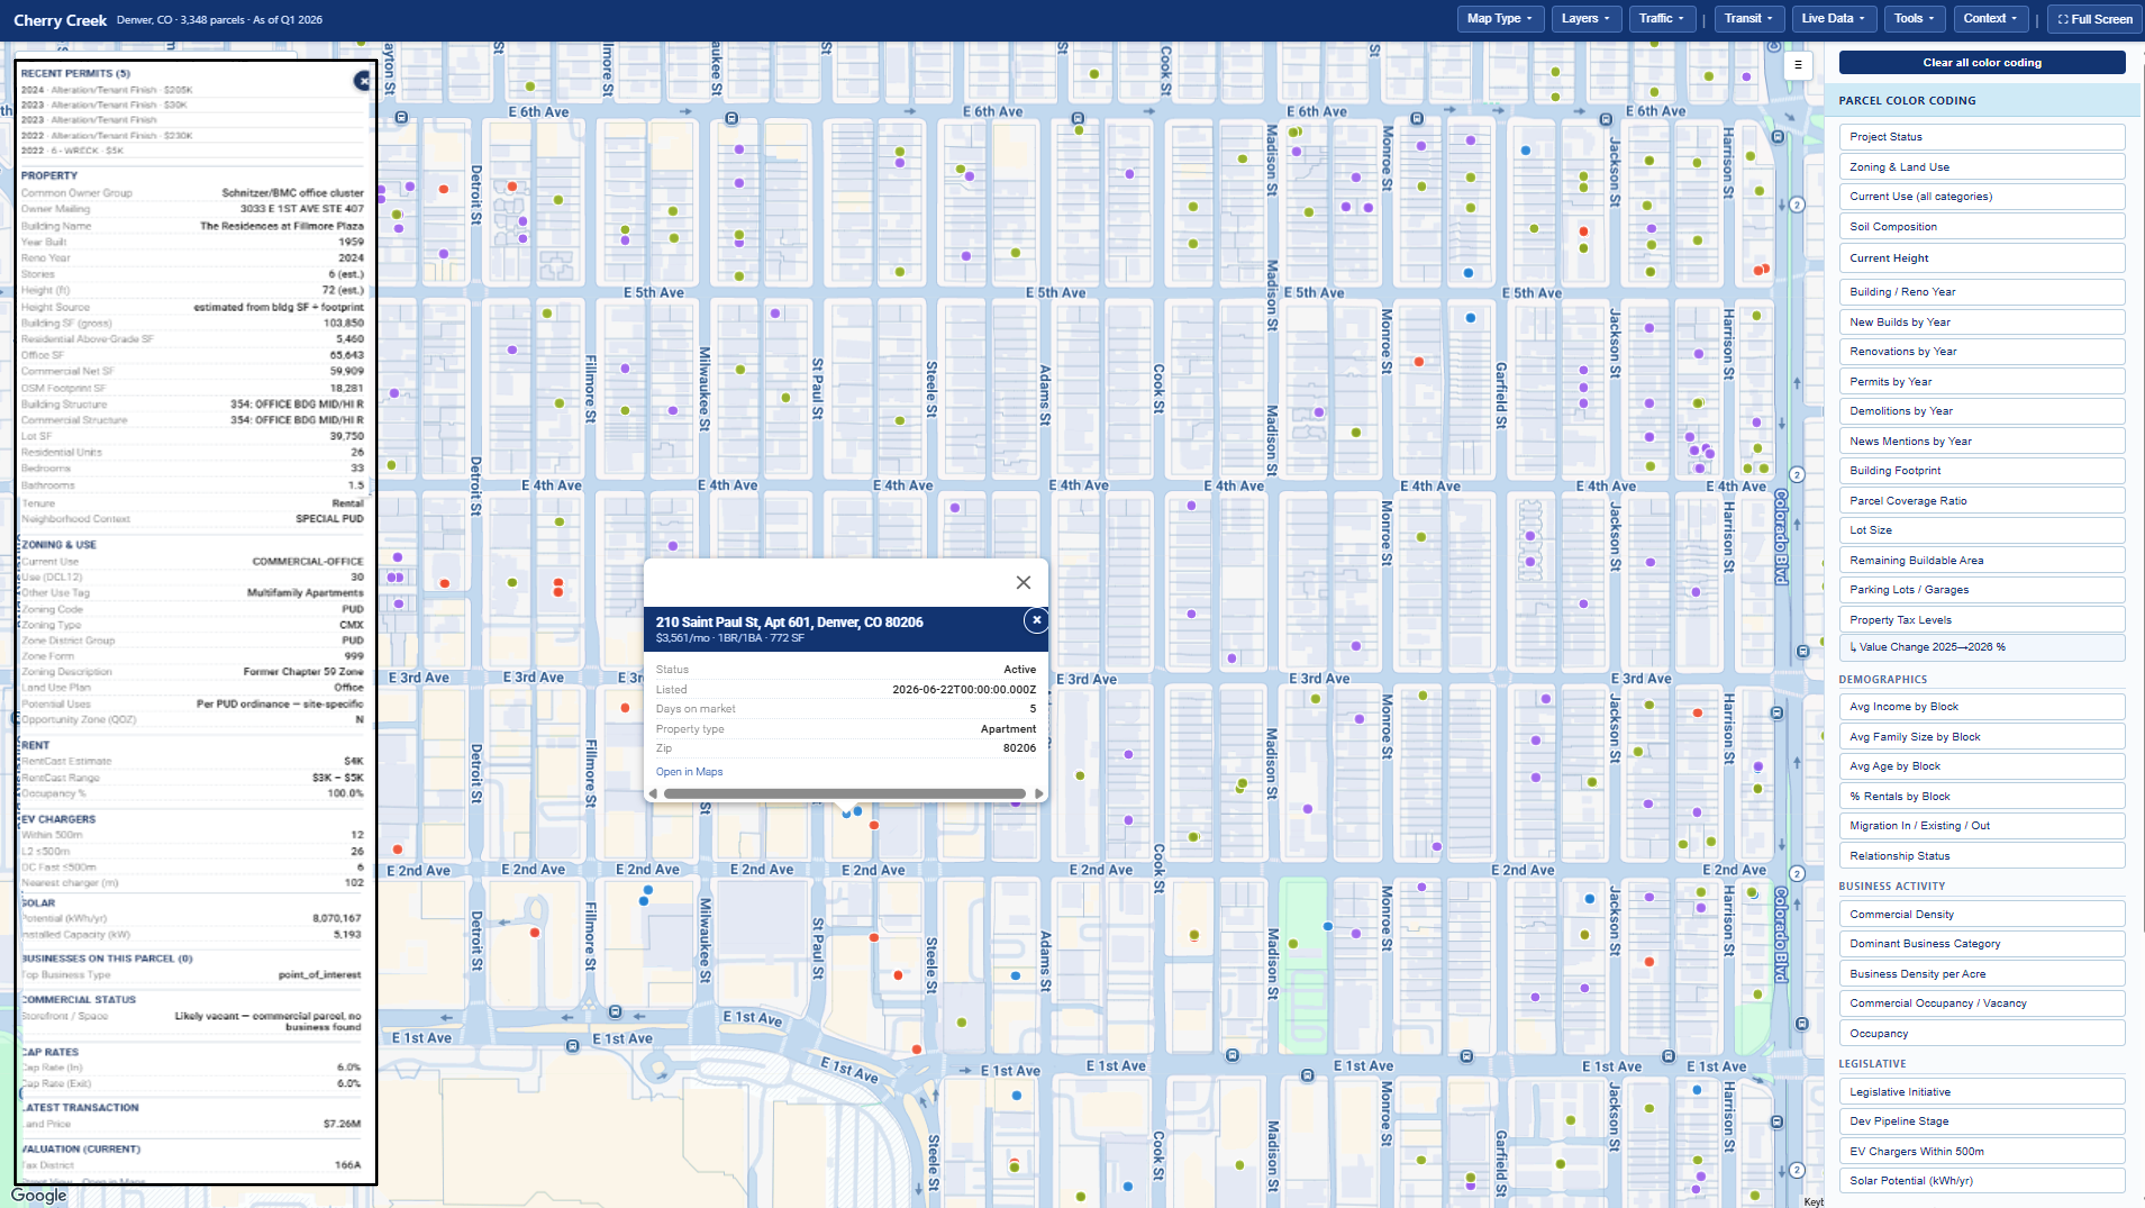
Extended Parcel Data w/ Live Listings
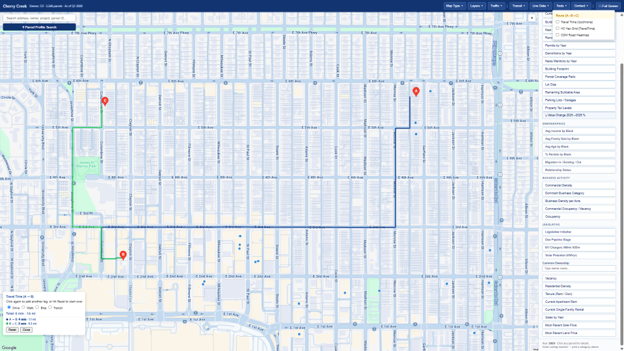
Multi-Stop Trip Routing
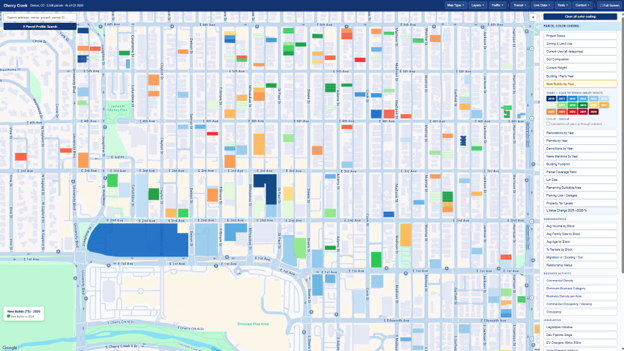
Time-Series Enabled Filters
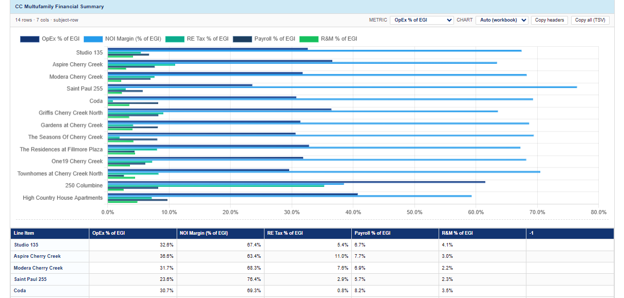
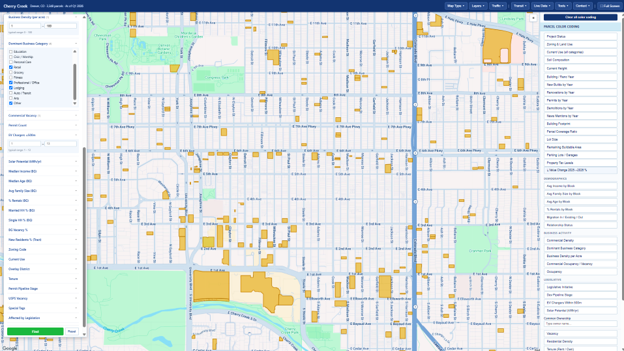
Complex Attribute Parcel Search
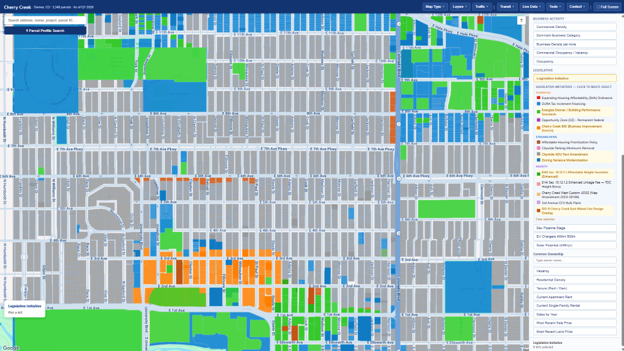
Legislative Mapping
The Data Story
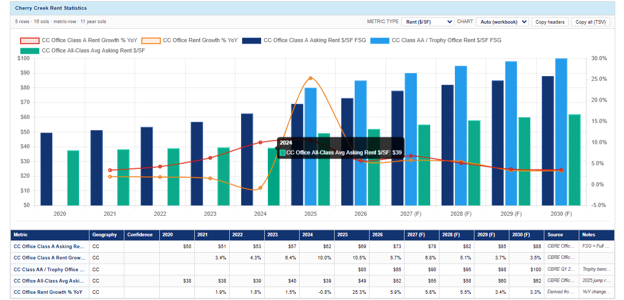
More data exists than can be visualized in a map. The data catalog is a is a collection of charts and tables that capture the rest of the story. It incorporates all available data from current (free) resources and institutional reports in addition to the resources mentioned above to paint a clearer picture of the market story at every available economic level.
Supply
Comparisons
Industries