Crisis and Opportunity
“Everyone Breaks.”
Having worked on a number of large California projects, I wanted to to add a section to discuss the unique opportunity emerging from the current housing crisis on the West Coast. As many “development friendly” markets deal with the post-covid wave of supply shock, there is no other region with more immediate opportunity for housing development .
Considered unnecessarily risky and complex by many national investment teams, the state of California has gone to extreme lengths since 2019 to stimulate housing development by producing legislative initiatives that incentivize and protect developers. After years of refinement, density is finally being generated in highly desirable NIMBY markets that have long been known to torpedo large projects and cost developers millions.
As construction costs continue to rise faster than working professional wages, density becomes a priority to get deals to work. Coastal urban developers must choose between affordable projects or ultra-dense unit mixes which only certain demographic populations will appreciate (shared occupancy bedrooms, high-density units, 400sf SROs, etc..). Most coastal markets have geographic and economic barriers that force even highly educated working adults to regularly make compromises to remain local. Increased density will work in these areas.
Most investors and developers who have explored California markets are aware of the broad changes since 2019, but few firms have taken the time to fully appreciate the value created in 2024 and 2025. In Santa Cruz for example, there is only one market rate project in the development pipeline utilizing a density bonus over the 50% threshold introduced in 2023. It seems clear that equity and sponsors have not yet taken the steps to fully capitalize on the most recent wave of legislative value creation.
Development Intelligence
Real-Time Supply, Demand, Legislative, Geologic, and Infrastructure Overlays from Direct Sources
New Developer Protections
Since the introduction of SB 330 in 2020, state legislators have continued to address the development vulnerabilities that come with the lengthy and complex entitlement process inherent in California projects. Adding incentives did little to curb the power of local communities to kill deals by exploiting technicalities and weaponizing paperwork delays. As a result, many of the bills introduced in the past several years have been designed to close these commonly exploited loopholes. In the last several years, affordable projects across the state have seen more traction. Today, cities are modifying their design standards to align with state incentives, and communities known for opposing new housing development are considering automatic approval processes for certain projects to avoid appearing powerless in front of angry residents. Progress is being made.
While affordable housing has seen the most dramatic gains in process streamlining, new bills addressing efficiencies and loopholes in fee structure, rezoning, permitting, CEQA review, approval timelines, and other aspects of the entitlement process have been introduced to protect ALL housing projects meeting the pre-determined guidelines. I’ve listed some of the more important recent legislative steps below.
Process Streamlining/CEQA-Laundering Protections
SB 35 - Streamlined Approval Process for Affordable Housing - Effective Jan 1, 2018
SB 330 - Housing Crisis Act of 2019 - Effective Jan 1, 2020
AB 130 - Budget Trailer - Effective Jun 30, 2025
SB 131 - Public Resources - Effective Jun 30, 2025
AB 2011 - Affordable Housing and High Roads Jobs Act of 2022 - Effective Jul 1, 2023
Rezoning and Adaptive Reuse Pathways
SB 6 - Middle Class Housing Act of 2022 - Effective Jan 1, 2024
AB 529 - Adaptive Reuse Projects - Effective Jan 1, 2024
AB 1490 - Adaptive Reuse for Affordable Housing - Effective Jan 1, 2024
AB 2243 - AB 2011 Commercial Site Housing Expansion - Effective Jan 1, 2025
Enhanced Density Bonus Law (DBL) Incentives
As most are aware, significant modifications have been made to the California DBL since the introduction of AB 2345 in 2021. In an effort to overcome the increased costs and additional risk of California housing development, the state has continued to add additional density incentives and concessions (not part of this analysis) for projects that include an affordable housing component equal to at least 5% of base density. The most recent modifications to the 1979 California law are listed below.
AB 2345 - Density Bonus Law Enhancements - Effective Jan 1, 2021
AB 2334 - DBL VMT Area and 100% Affordable Enhancements - Effective Jan 1, 2023
AB 1287 - DBL Stackable Bonus Incentives and Additional Concessions -Effective Jan 1, 2024
AB 3116 - Additional Density Bonus Benefits for Student Housing - Effective Jan 1, 2025
AB 2694 - Extenstion of DBL Benefits to Elderly Residential Care Facilities - Effective Jan 1, 2025
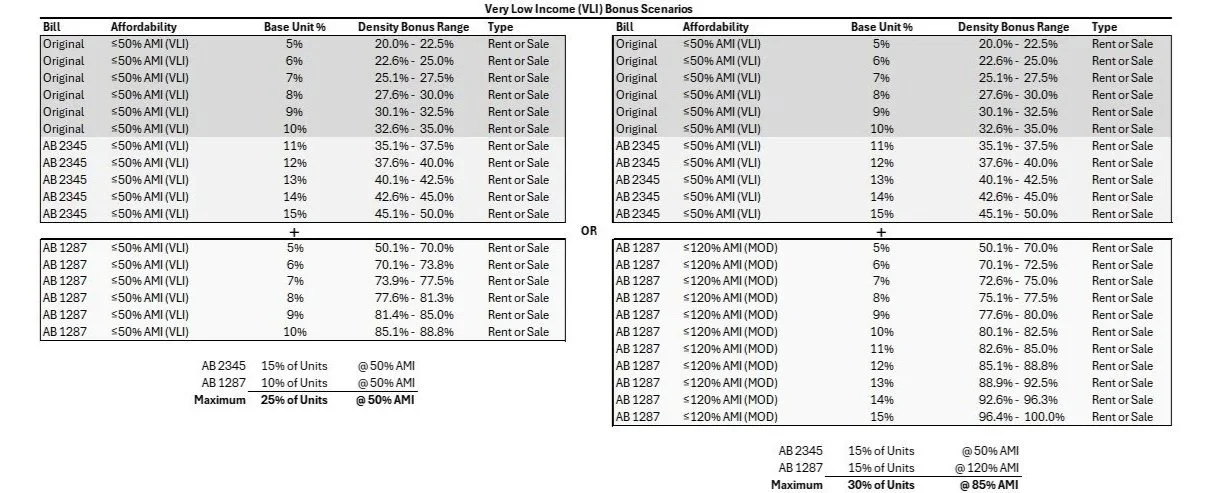
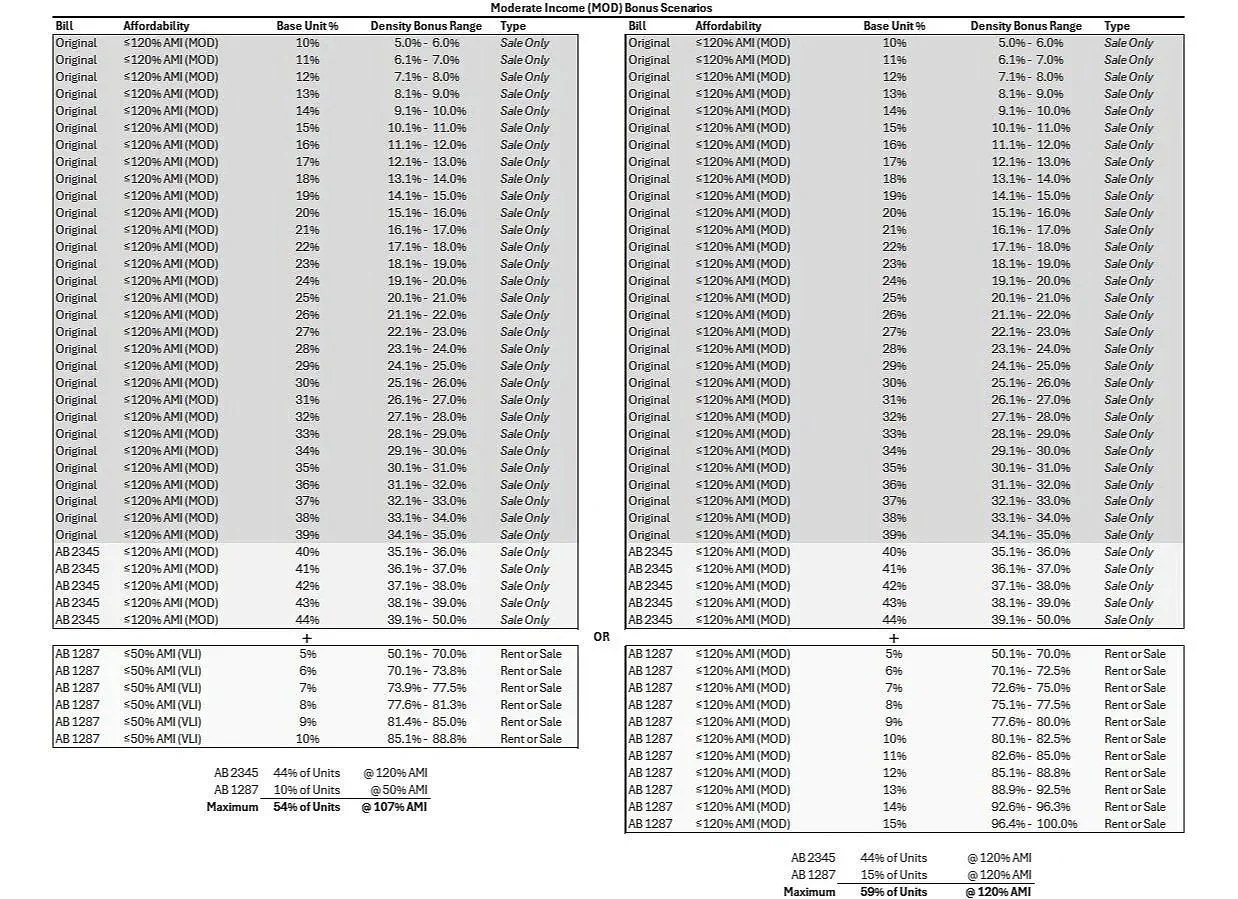
In it’s current form, there are six combined maximum density bonus scenarios at very low income, low income, and moderate income levels using the stackable bonus incentives that were introduced in 2024. These pathways show the relationship of each level of additional density to income level and affordable unit percentage in addition to the legislation responsible for the bonus.
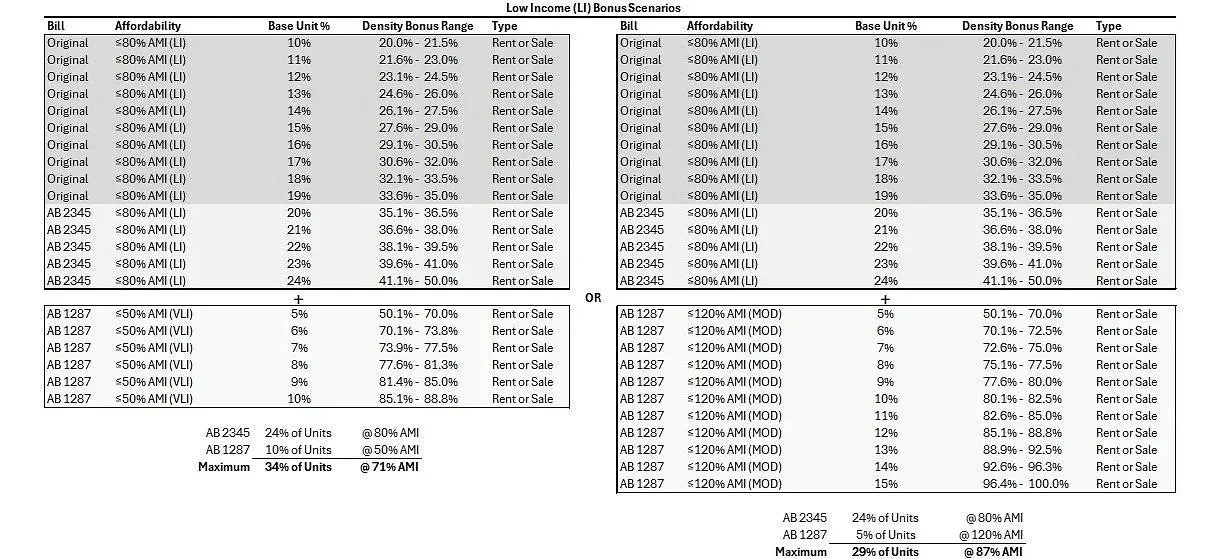
Many developers explore these scenarios on a site-by-site basis but don’t necessarily investigate how stackable bonuses affect value across an entire market. This is important when evaluating markets with historically low levels of liquidity because of the relationship between pricing and recent transaction data, the lack of comparable developments, and the challenges of parcel assemblage. Understanding recent changes to the usable acreage needed for a viable deal in a market where very little has been built can create a massive competitive advantage for any developer. The remainder of this roadmap compares the established benefits of AB 2345 to the new (and relatively underutilized) value created by AB 1287.
Redefining Relative Values
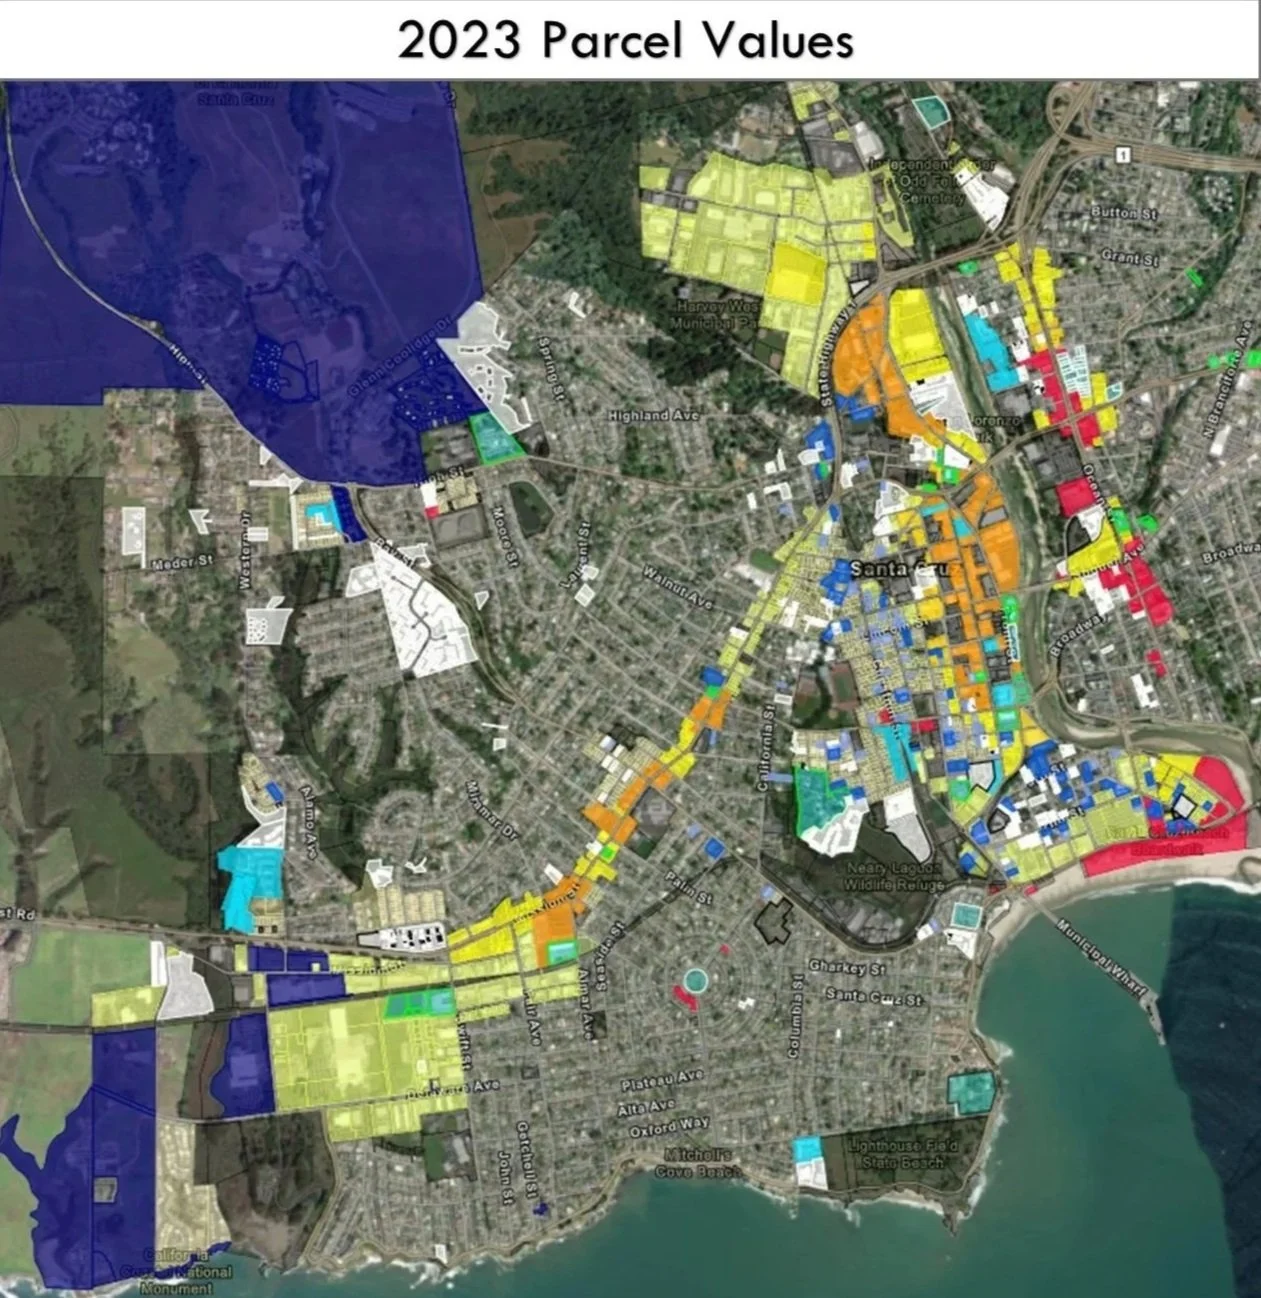
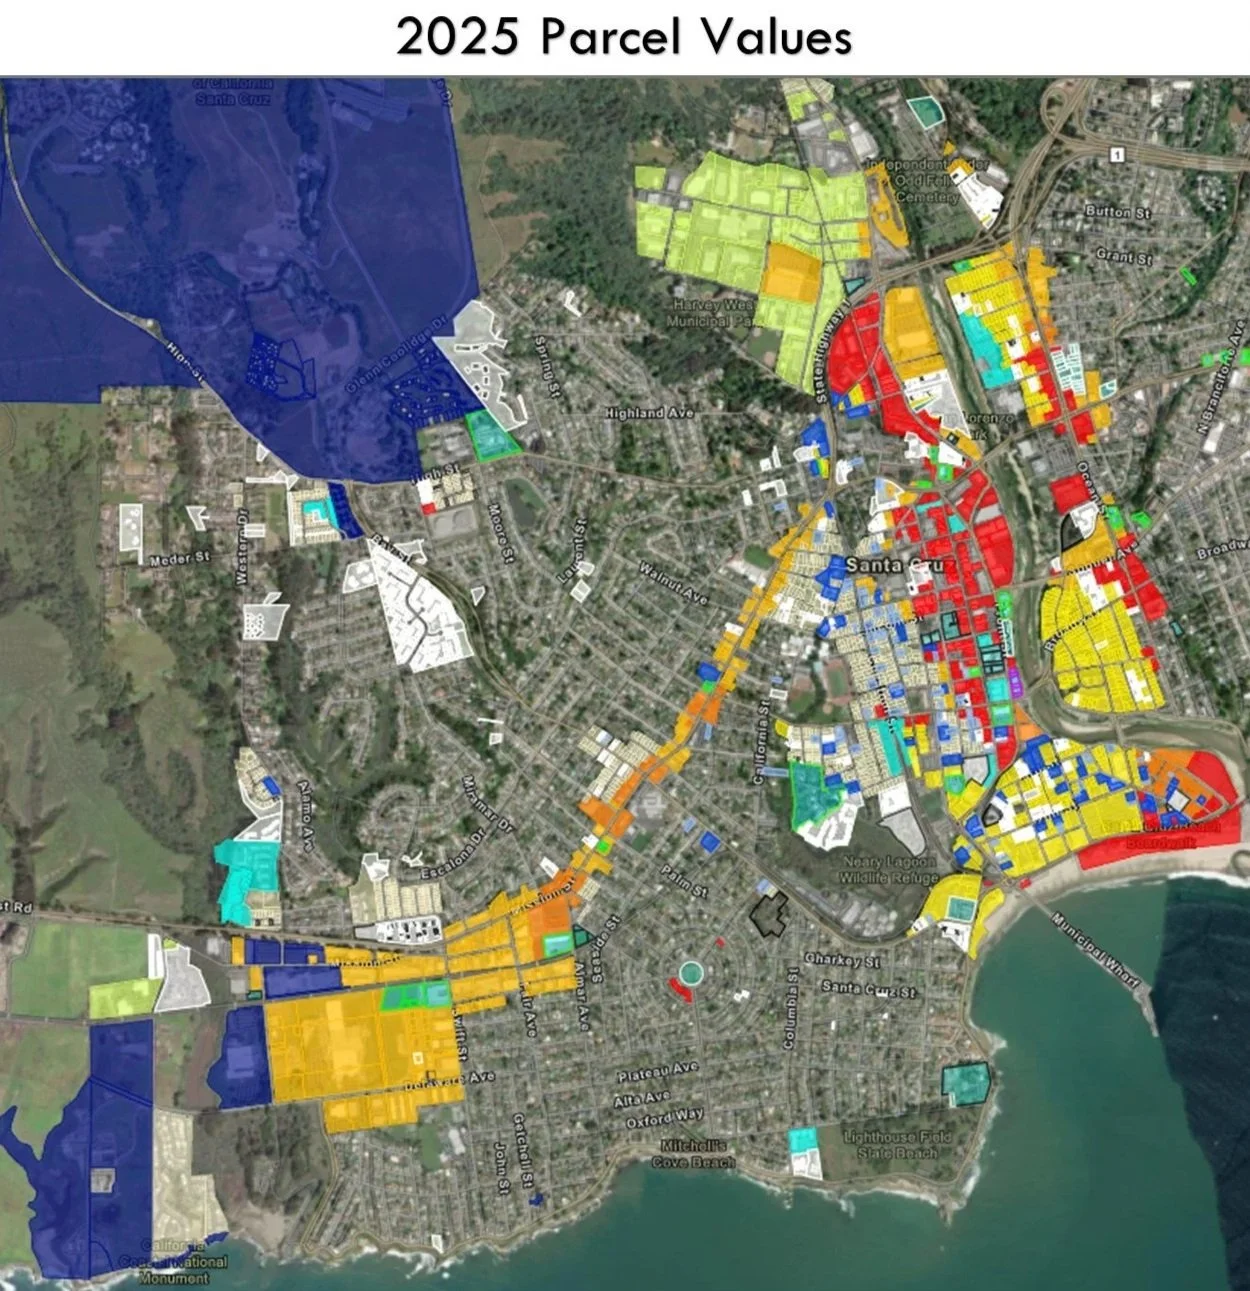
If a parcel’s value is directly correlated to its production potential, then the most relevant way to quantify new parcel value is to compare the former and current per-acre production potential of each parcel type. An early understanding of this value creation creates a first-mover advantage throughout the execution of any investment strategy.
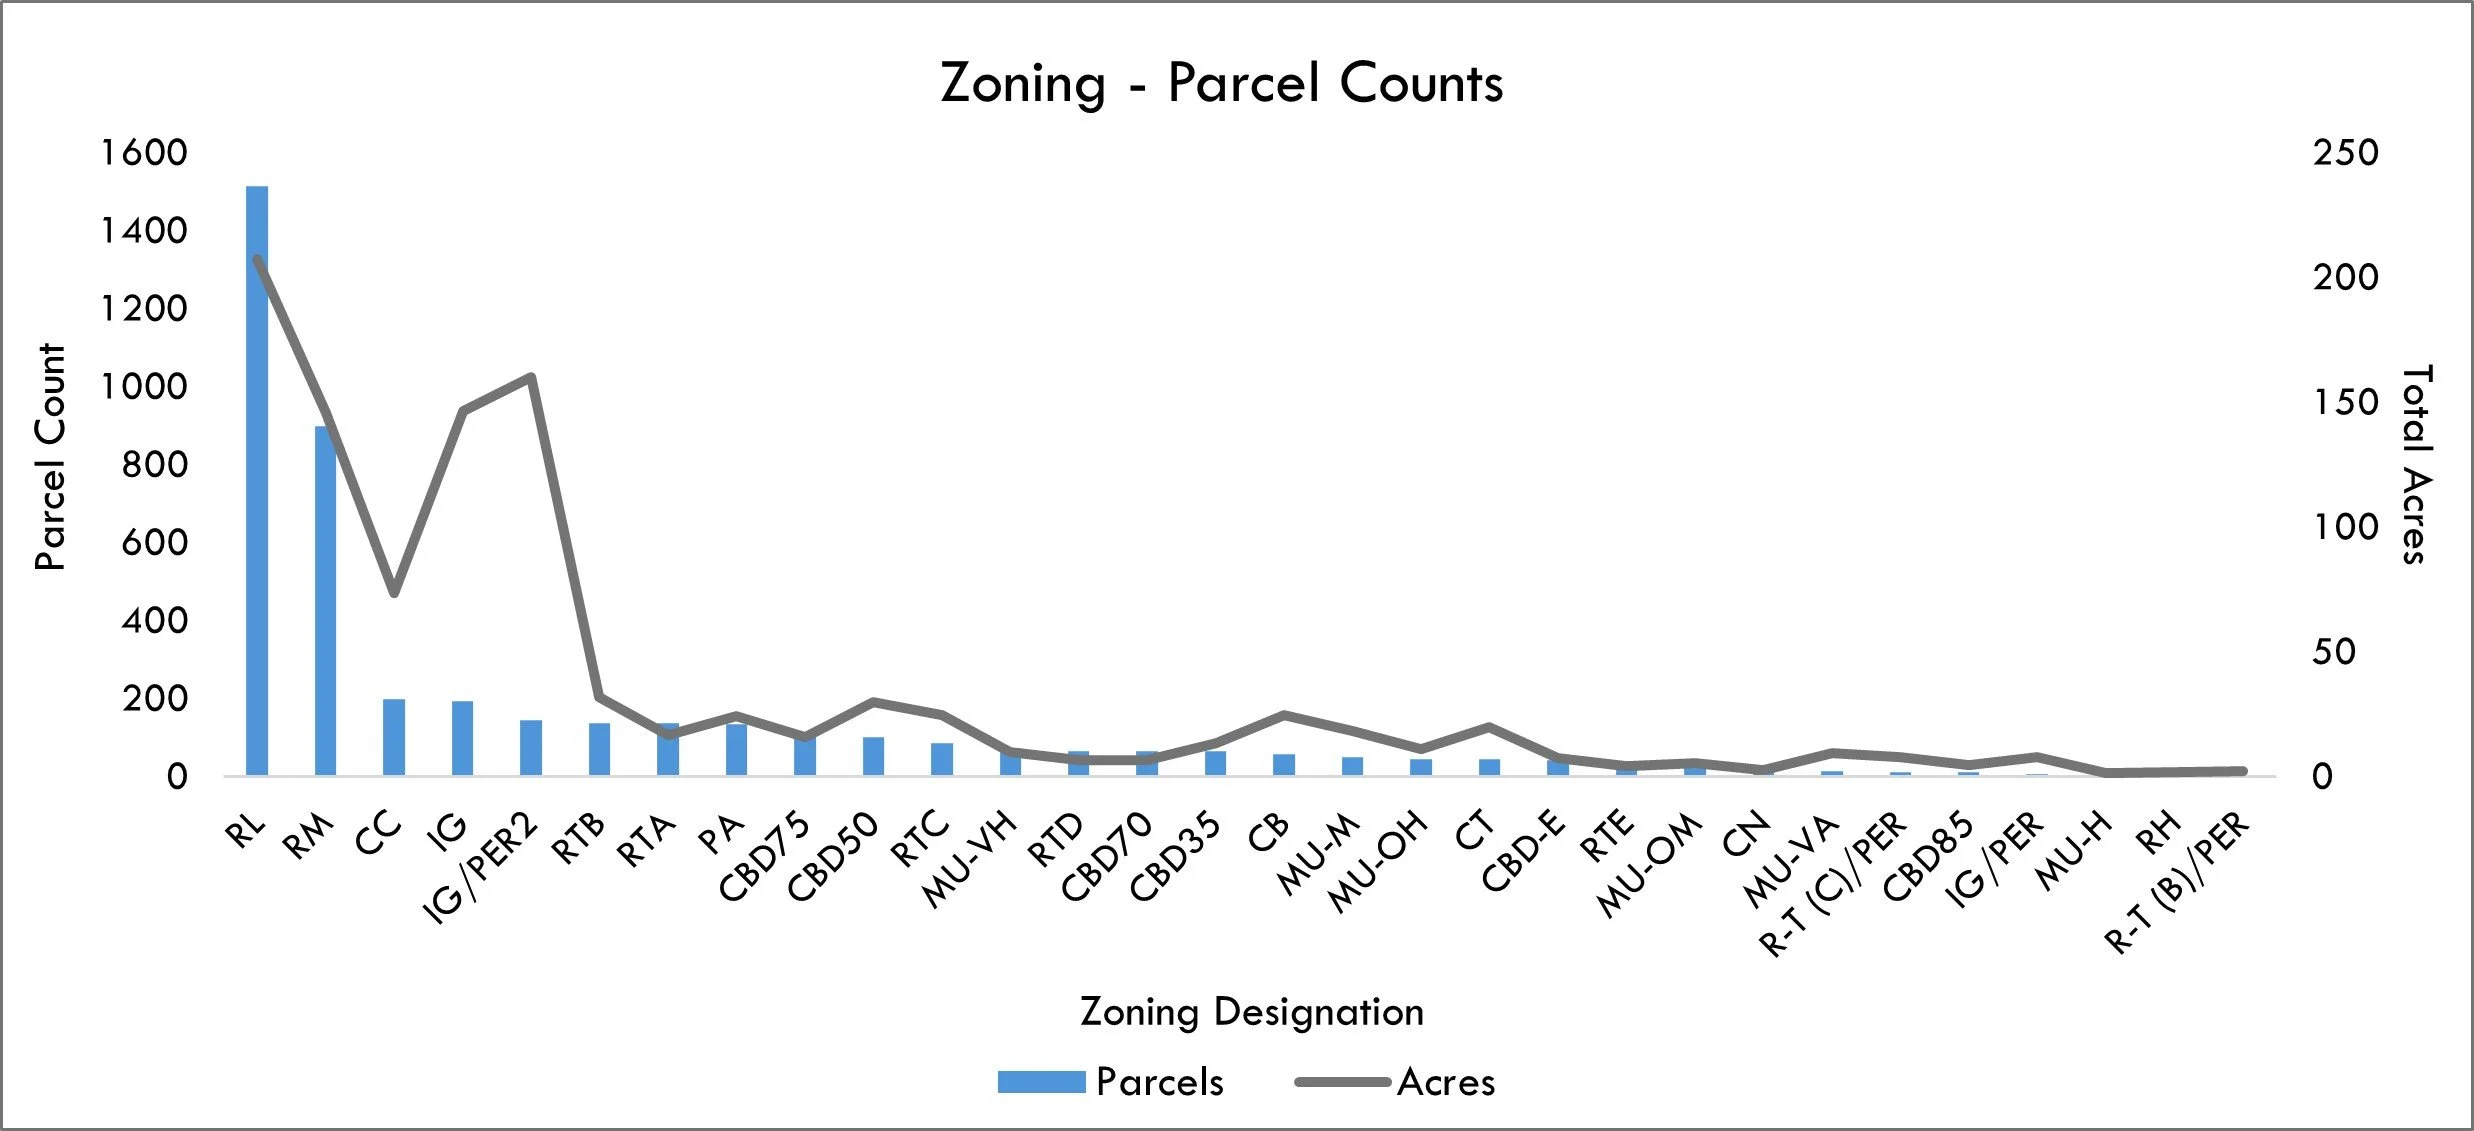
The scope of the new opportunity depends heavily on the parcel composition of the market. Parcel frequency totals can be used to gauge the impact of value increases associated with each specific parcel type and to begin to understand where the best opportunities have emerged.
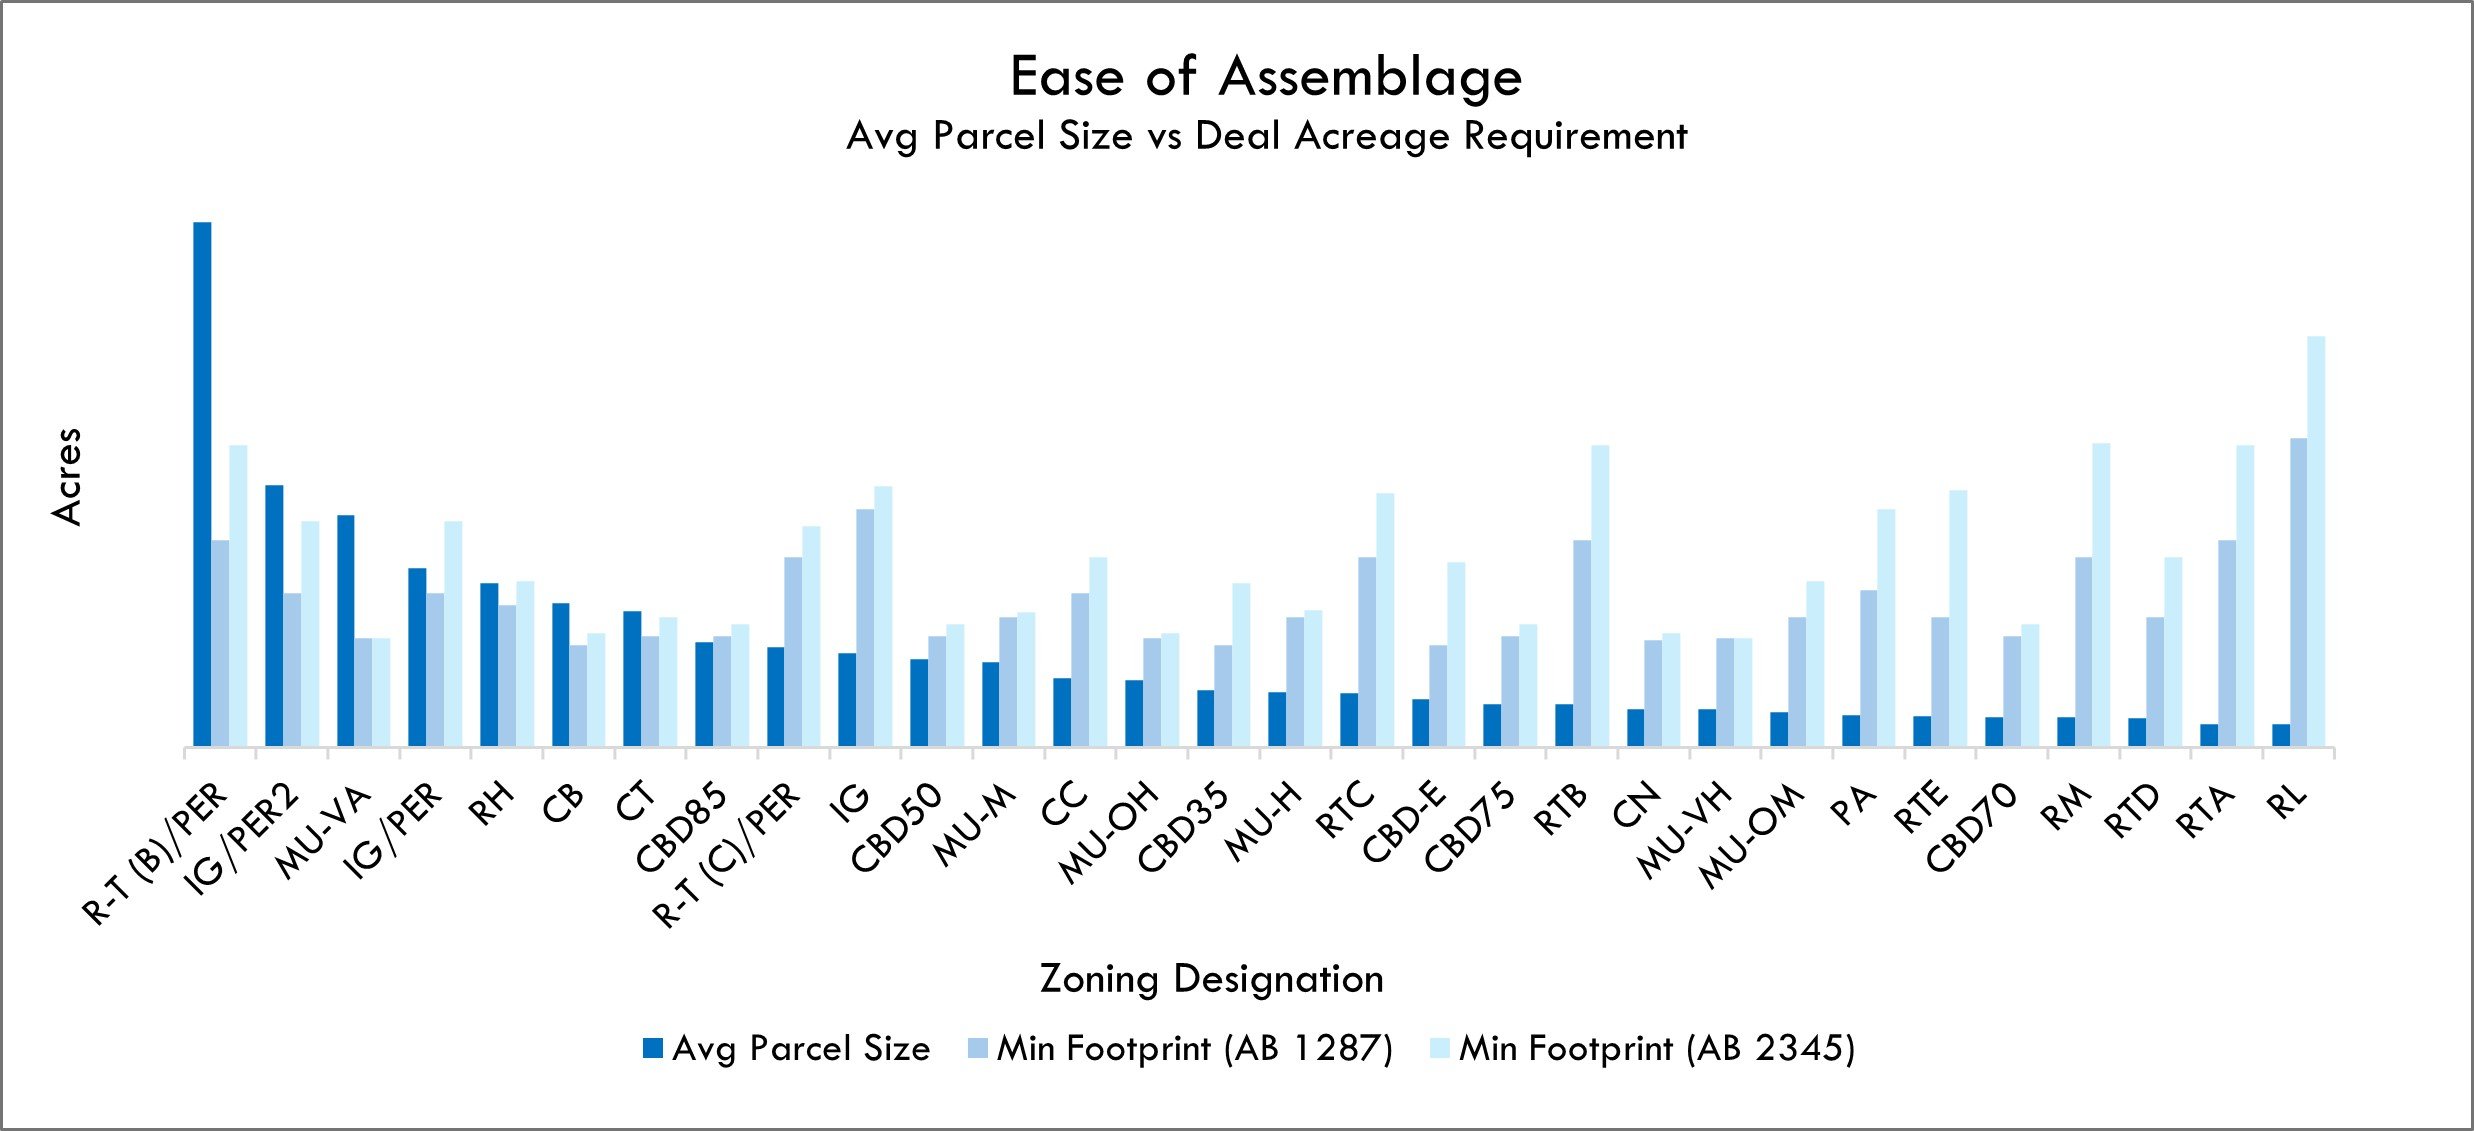
Determining Density Strategy
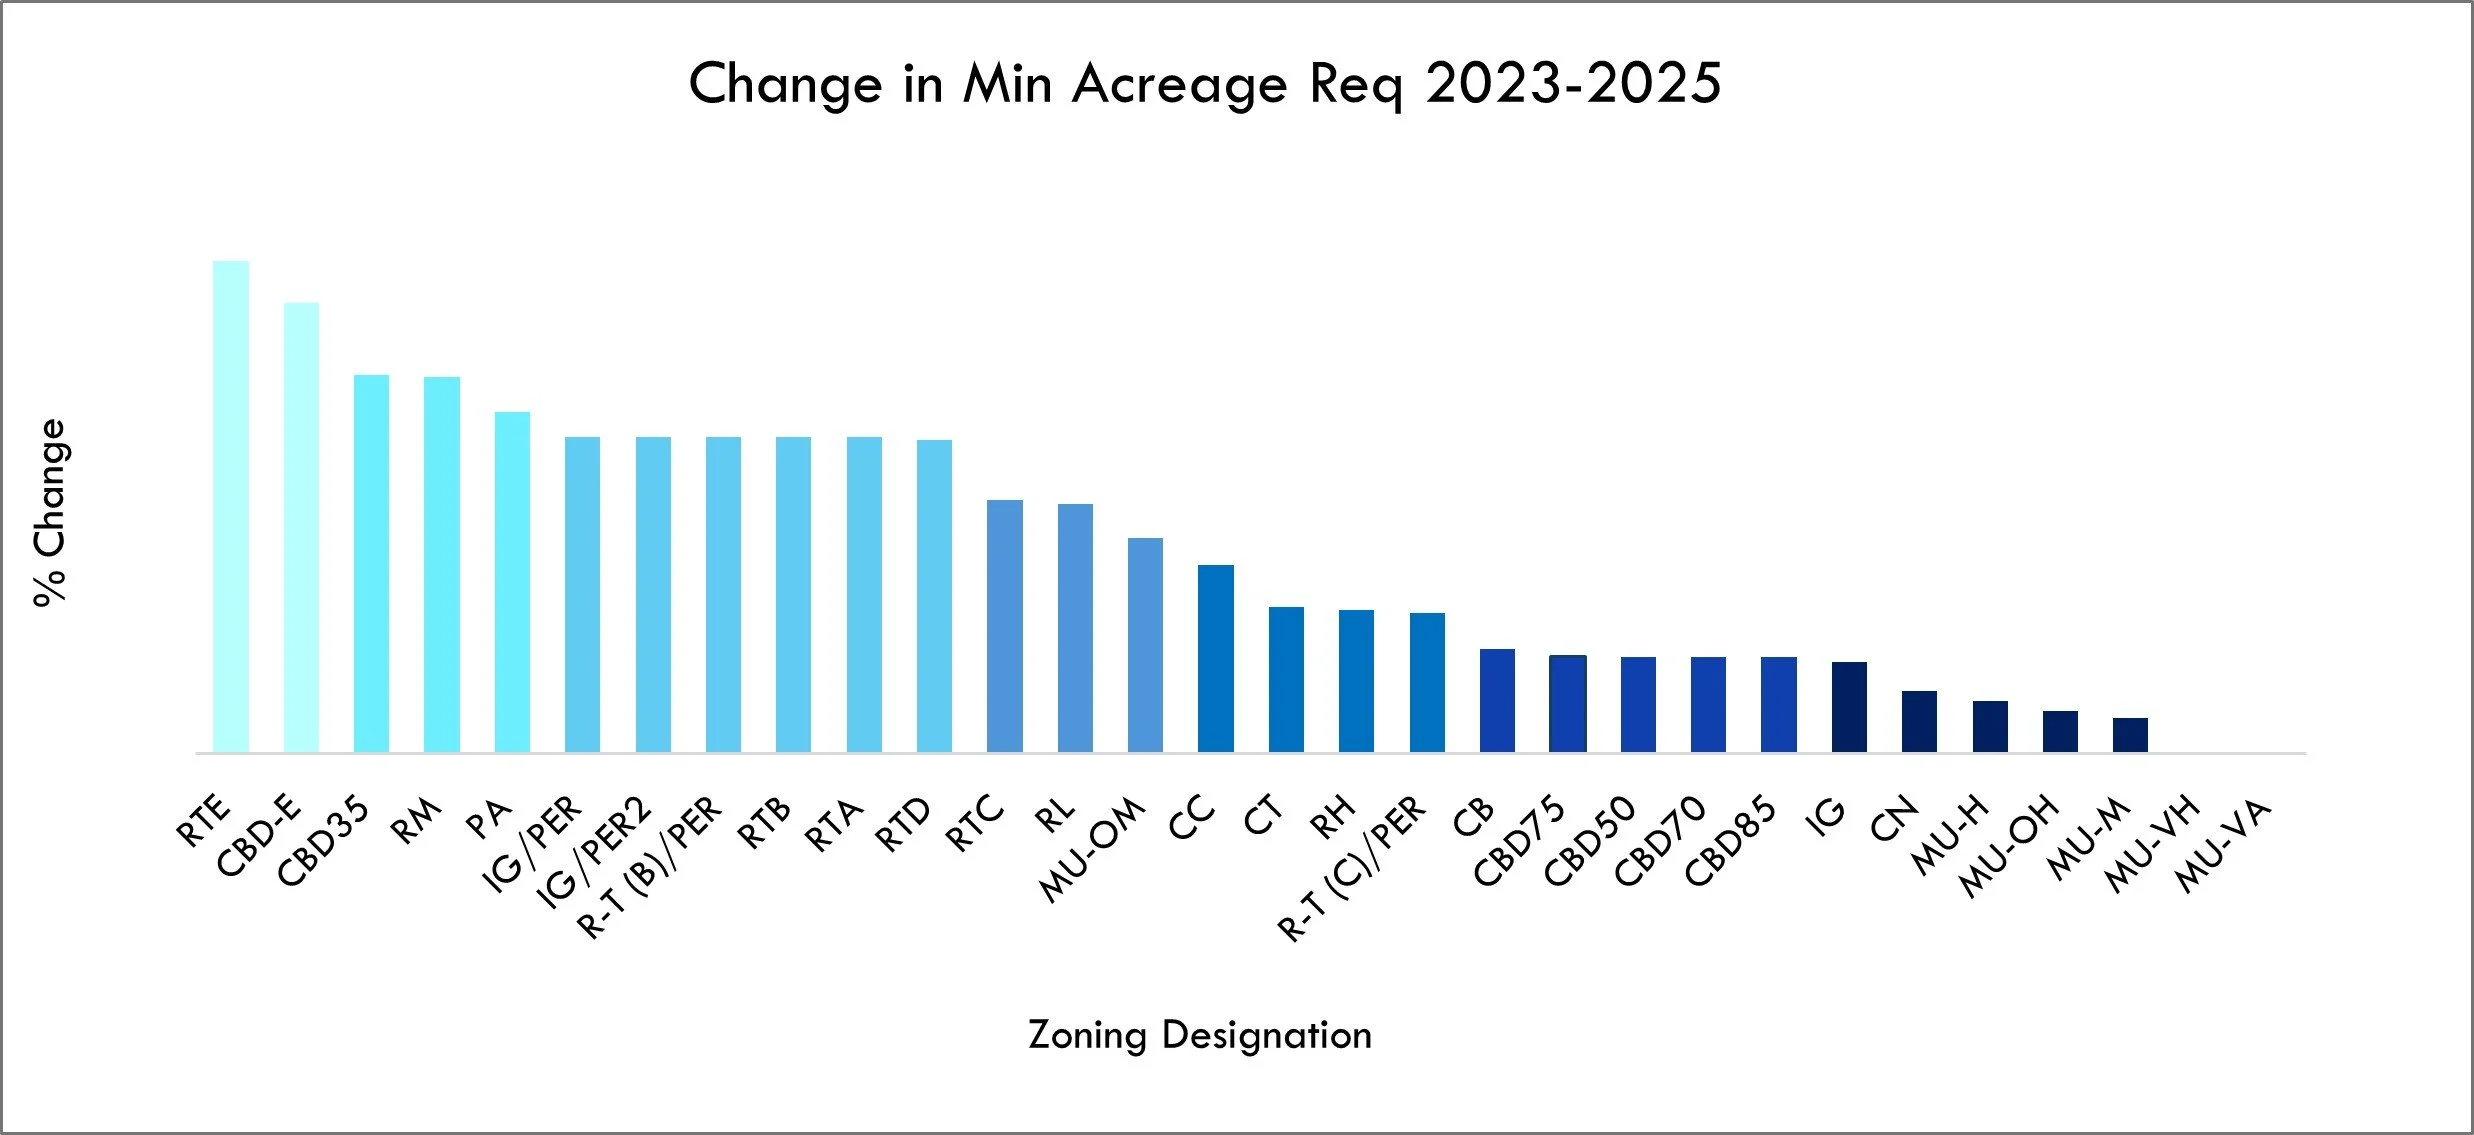
Once market composition and target density bonus levels have been established, parcel sizing scenarios can be run for each zoning designation to determine the minimum acreage required to produce a viable project. It is easier to generate these scenarios using a vba enabled density calculator that can handle all of the zoning characteristics associated with each parcel type. The goal is to compare the corresponding minimum project useable acreage required in 2023 vs 2025. The following results also incorporate the AB 1287 increase in permitted concessions from 3 to 4. All scenarios were run with current construction costs in addition to location-based rent tiers and land costs.
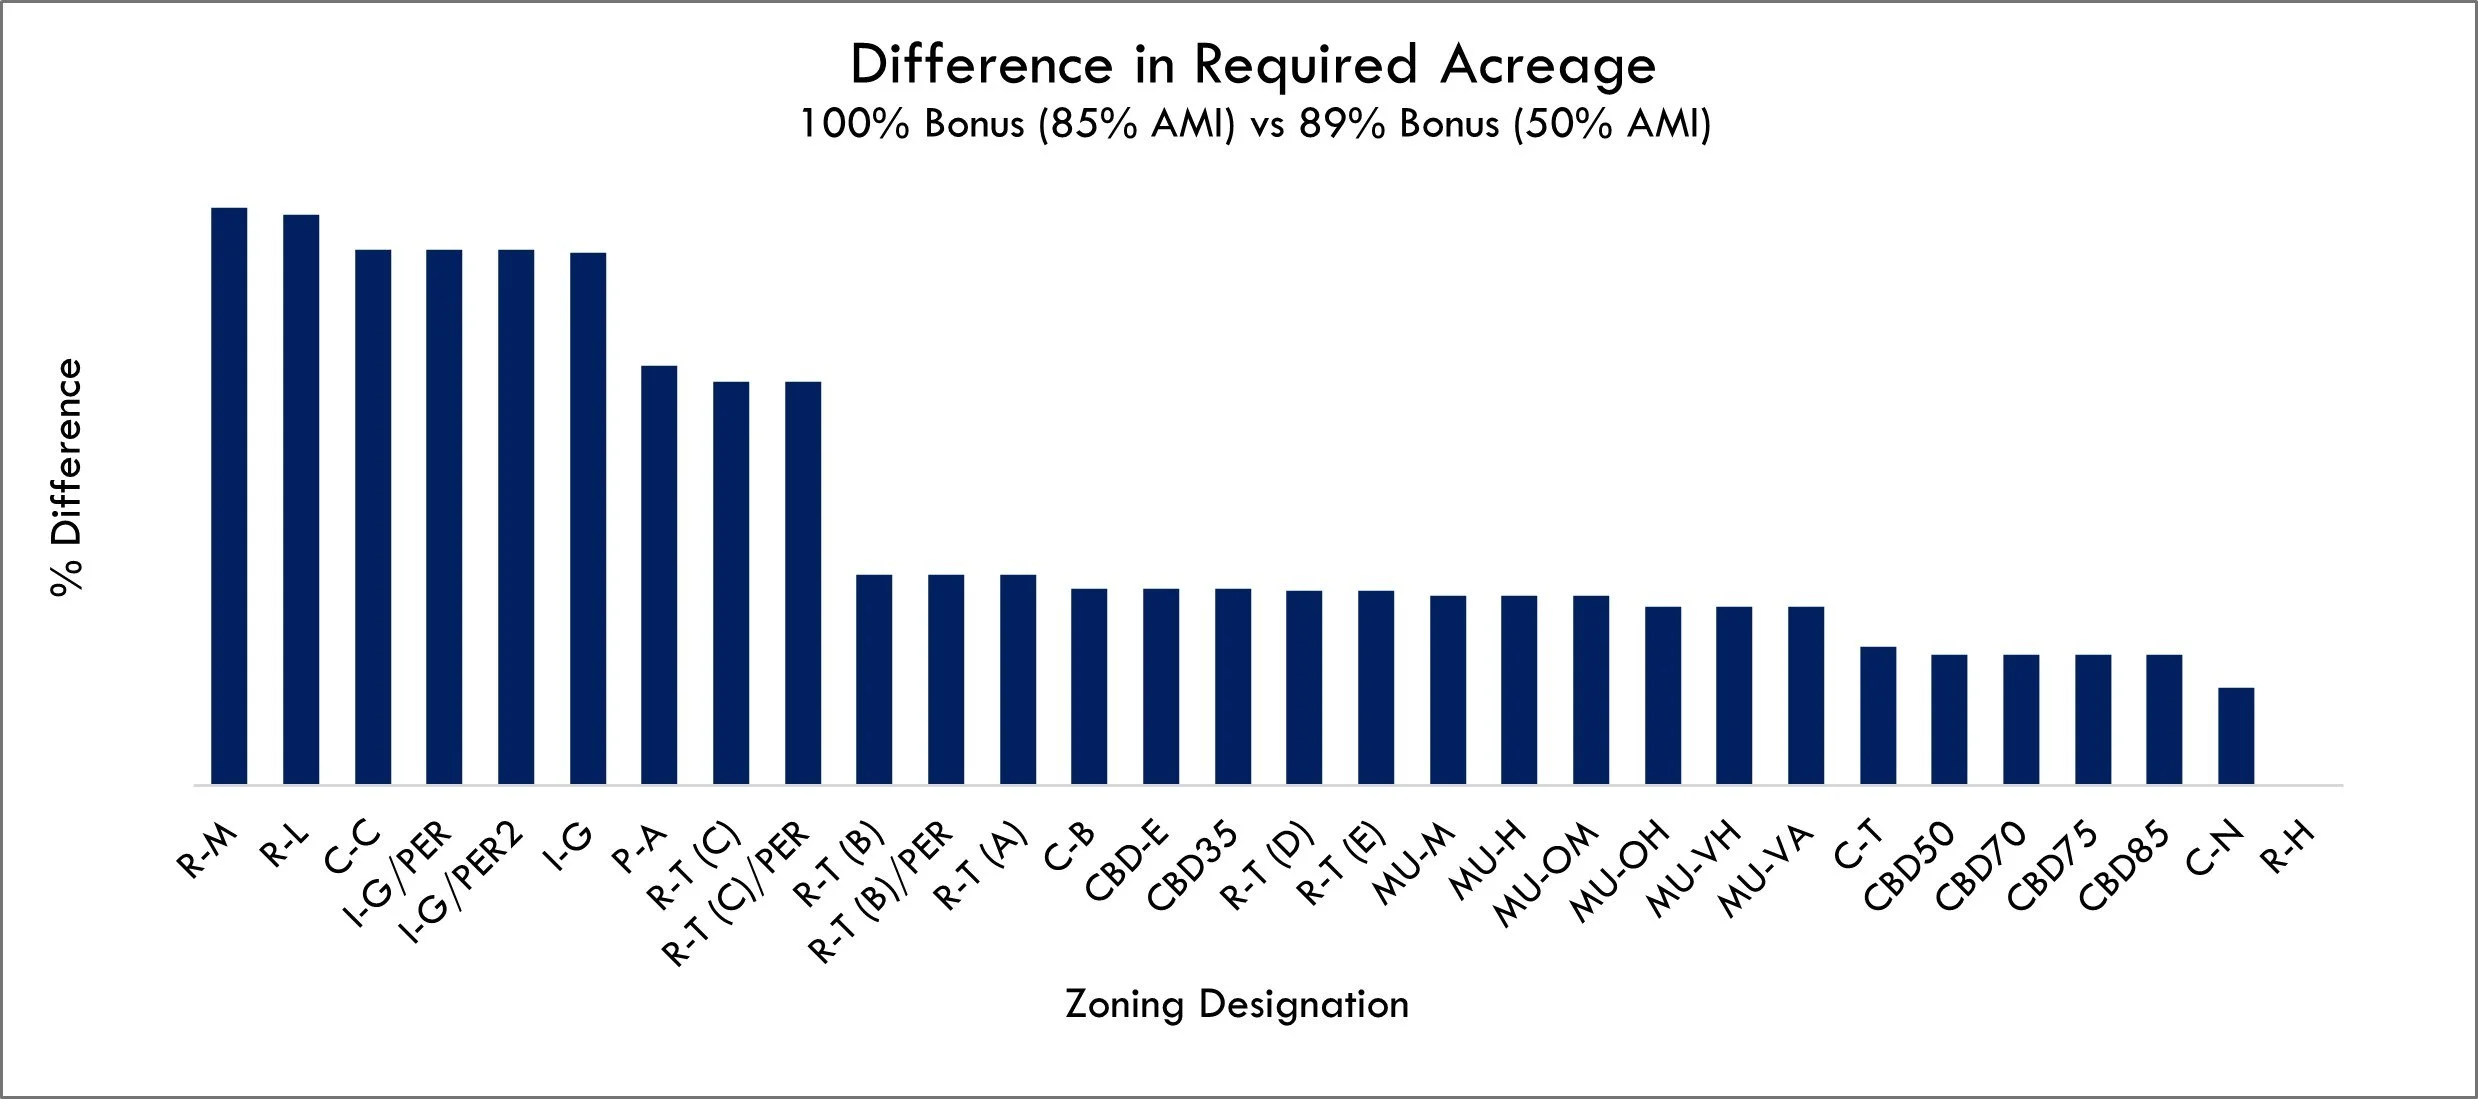
Prior to 2024, the California Density Bonus Law (DBL) carried a maximum bonus of 50% when allocating anywhere from 15% to 44% of the base unit density to affordable housing. As of 2024, qualifying for maximum density means a base affordable unit allocation of 25% at 50% AMI (88.8% bonus) or 30% at 85% AMI (100% bonus). When comparing the two options in Santa Cruz, residential parcels tend to see a more significant value increase using the 85% AMI density bonus structure. Commercial and mixed-use parcel density tends to be more commonly determined by FAR and higher land coverage ratios, and therefore carry a similar minimum acreage requirement regardless of their maximum density bonus structure. Current sizing scenarios show a value shift of >10% for residential and lower-density parcels and <10% for non-residential parcels.
While height may be uncapped as a concession under the updated California DBL, none of these scenarios assume extreme height deviation from current design standards. In this market, ideal project height is more often determined by the contrast between estimated hard costs and underwritten rent projections. Land and construction costs in Santa Cruz are high enough to challenge the feasibility of any plan calling for more than seven stories. The most notable economic efficiencies in this exercise appear at heights between 35’ and 65’.
Comparing Results
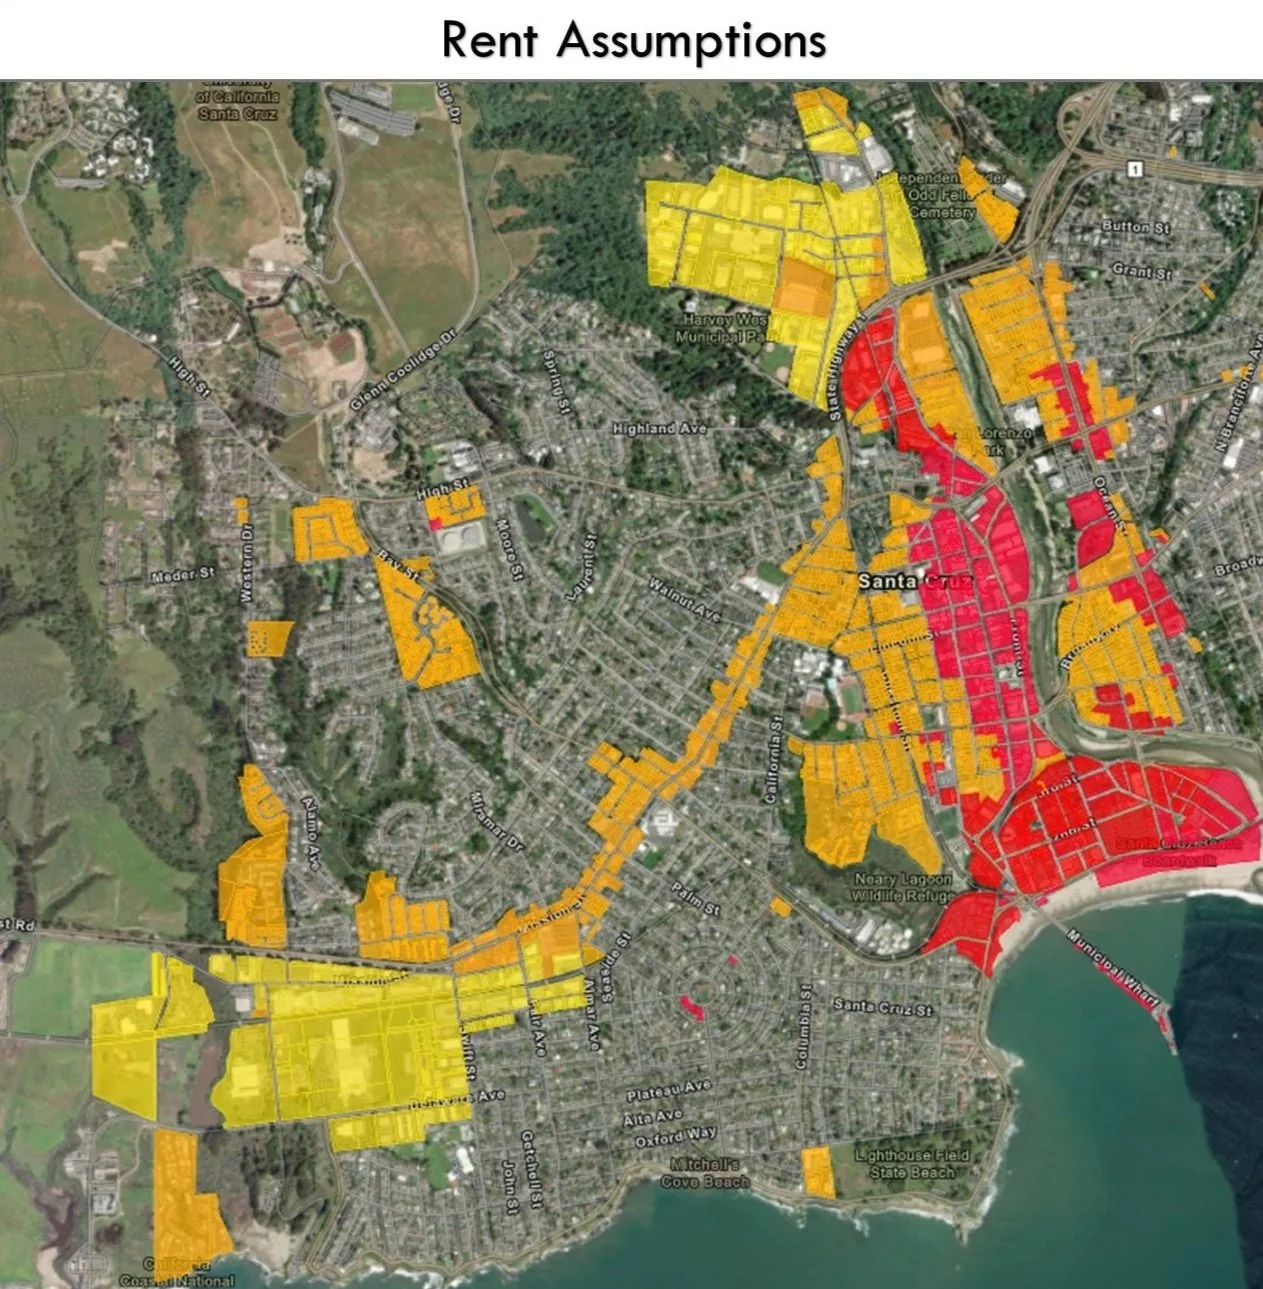
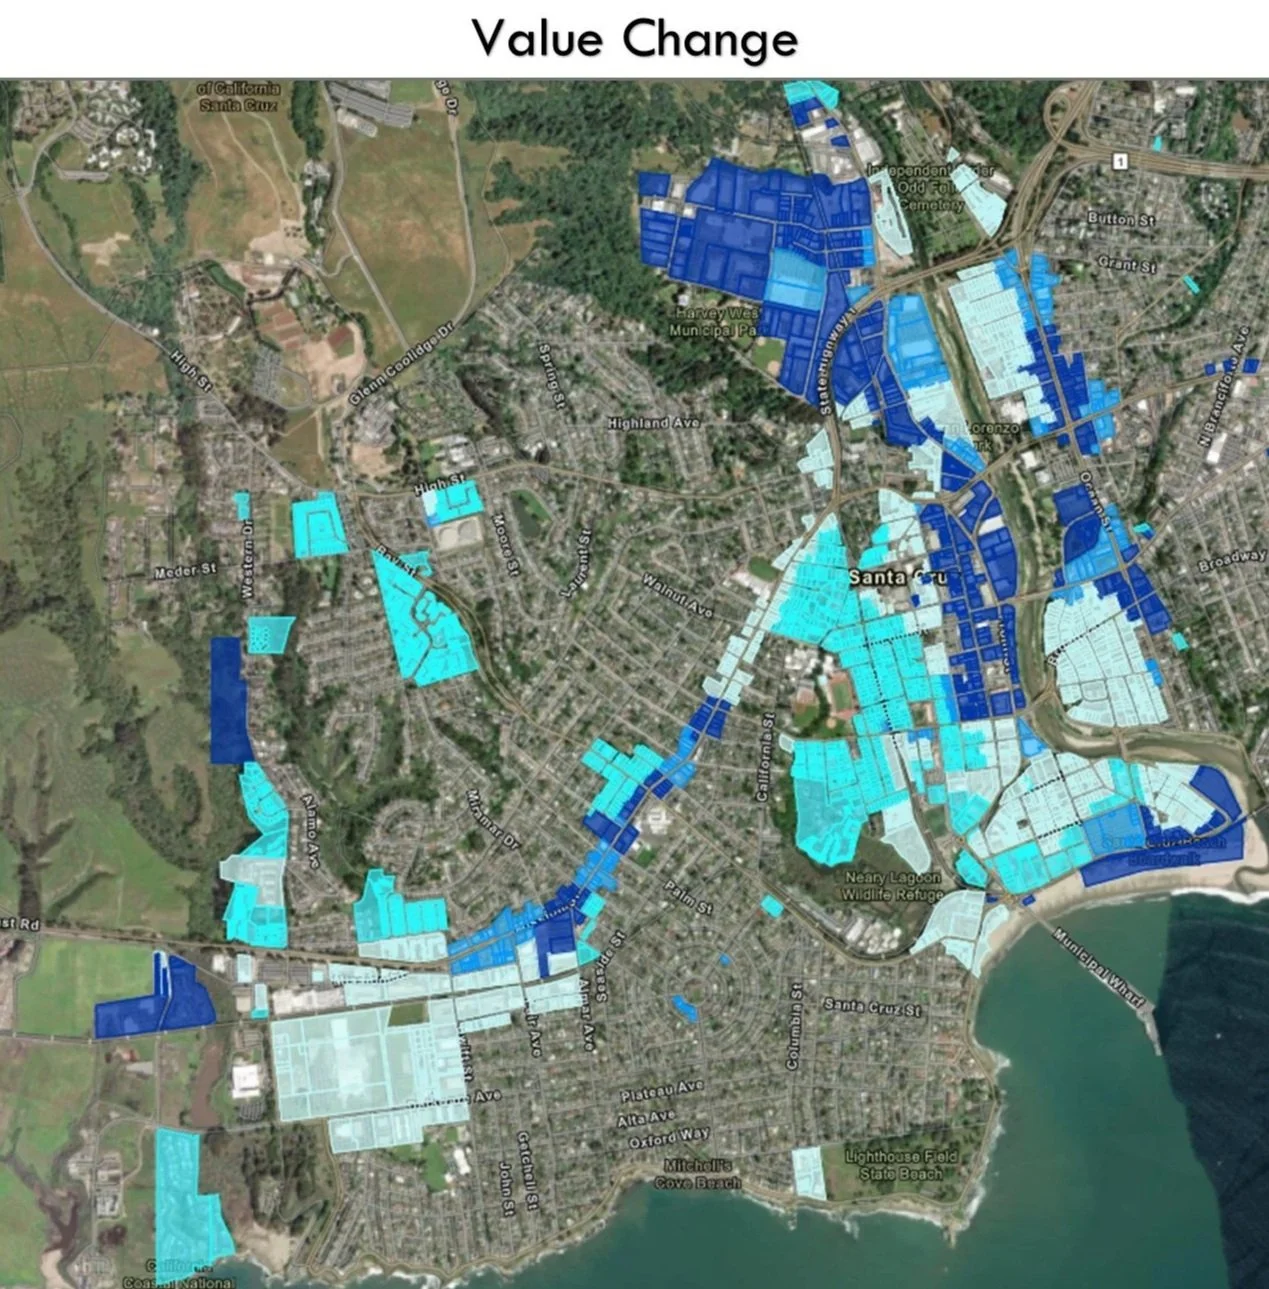
Mapping the Outputs
Once value change can be quantified by zoning designation, the results can be applied to a parcel map to build a spatial understanding of the new value framework. Understanding this data can help investment teams de-risk their projects as they focus their efforts on undervalued parcels in locations with a high degree of unrealized potential. Once transitioned to map format, the information can also be combined with other relevant map types (traffic, transit, crime, etc) to uncover additional value.